La Gioconda and Knowledge Graphs.
Last updated: May 15, 2019
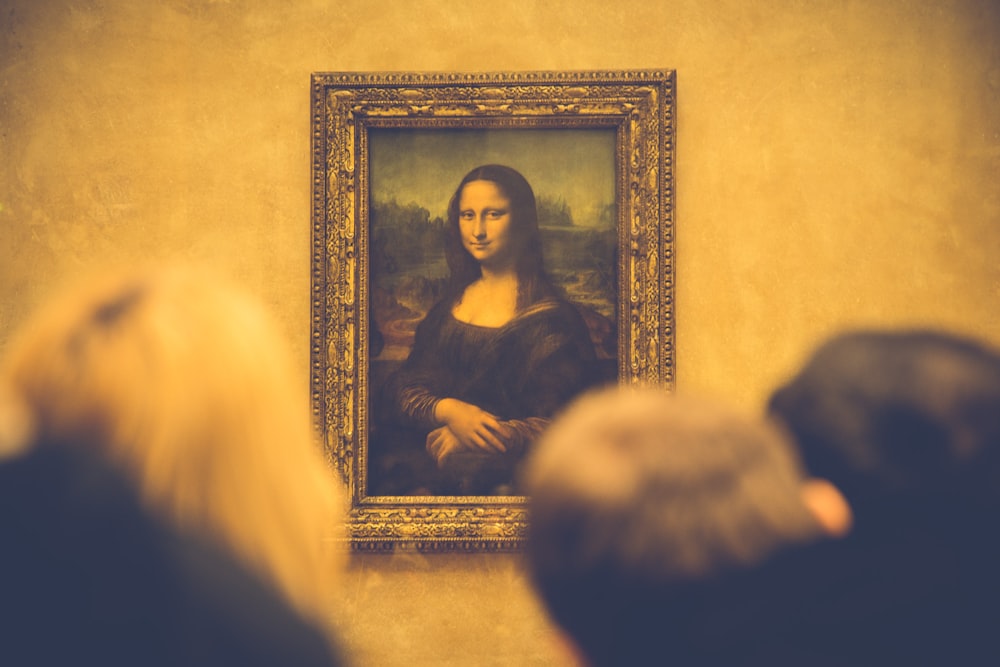
When we think of the famous painting La Gioconda, our mind automatically makes several connections, for example we can visualize her singing giggle, remembering that it is located at Louvre, a great museum that receives thousands of visitors daily, which was painted by Leonardo da Vinci, who was a genius of the arts and sciences, and so on and so forth ... There are several neural paths that can be navigated in our brains while we think about La Gioconda, whether it is about art, or about a friend visiting Paris, etc. For us humans, this is natural.
And computers? Can you imagine how a virtual assistant like Amazon from Alexa could establish a dialogue with a human and follow his/her on different subjects, after all, one conversation leads to another. An Alexa that knows and talks about everything?
Well, this is one of the challenges of Artificial Intelligence and one of the research areas that is trying to tackle this problem is the adoption of knowledge graphs (Knowledge Graphs) to power the intelligence of the machines.
Graphs are a type of data structure, in which you can define entities in the form of nodes and types of relationships in the form of vertices. The figure below illustrates the idea. We can see several entities, in this case the La Gioconda painting and its various types of relationships with other entities, for example that the painting is exhibited in the Louvre, which was painted by Da Vinci, who Bob is interested in, and Bob is a friend of Alice's, and so on. The term Knowledge Graph was introduced by Google in 2012 as a resource to optimize its search engine using information from various sources, including Wikipedia (which is also another classic example of Knowledge Graph).

As you could see, a Knowledge Graph depicts the relationship of several entities, providing meaning. This is extremely important for machines, who could use this information to contextualize better the topics in dialogs (back to our Alexa example), disambiguate terms (example differentiate Ford, from president Ford to Ford the car company) and even make small inferences.
On May 7 and 8, 2019, I had the opportunity to attend the first Knowledge Graphs Conference at Columbia University in New York. There were two intense days of case presentations from several companies such as Capital One, Wells Fargo, Amazon, Uber, Airbnb, among others. These companies are adopting Knowledge Graphs to relate data such as, for example, comments about their products and services on twitter, facebook, etc. and simultaneously with facts, news, actions of competitors and thus compose a knowledge base that can be used to extract insights, recommendations and other specific business information.
Columbia SPS Executive Education: 2019 Knowledge Graph Conference


In addition of the intensive use of Knowledge Graphs in problems involving natural language processing, I was surprised that Knowledge Graphs are to be used in Supply Chain and other critical operations problems. One of the great presentations that I took away was that of Mr Steven Gustafson from MAANA He presented a framework that seeks to understand the strategic decisions that a company needs to run its supply chain. The approach to the problem in question - crude oil ship logistics - was to build Knowledge Graphs with all the important variables (collected from different data sources) and their relationships with each other. One of the innovations was the possibility of detailing some of the critical variables in the form of "Function Graphs", where the decision maker can visualize in a simple way how these variables are determined.
Well, if you liked the subject, know that Knowledge Graphs, according to the latest Gartner survey, is one of the hottest emerging technologies in 2019.
I intend to bring more examples of applications and news about the further developments of this topic.
